
Modelling and Simulation of Metabolism
(Electron Transport Chain of Escherichia coli)
(Version: June 2016)
The metabolism is a network of reactions in which reaction partners (metabolites) interact with each other leading to concentration changes and in the event to certain macroscopic functionalities (e.g. energy conversion or growth). The reactions are catalysed by specialised proteins: the enzymes. Their activities which are influenced by their amounts (concentrations) have a large impact on the velocity of individual reactions and thus on other reactions and on macroscopic phenomena. The enzyme concentration can be regulated by gene expression in response to (external) changes. In a certain time range this is one of the major adaptations of living beings.
In Systems Biology, modelling of metabolism helps to unreveal certain aspects and mechanisms. In contrast to other biological sub systems the focus is not so much on finding new interactions on the top-level of the reaction network but on the combination of individual mechanisms, their parameters and last but not least on sub models describing and understanding the regulation of metabolic reactions. The modelling step (structure and equations) is in most cases followed by adjusting unknown parameter values, simulations as well as their interpretation. In the following this whole work flow is presented by the help of a realistic example.
Background
The electron transport chain (ETC, also: respiratory chain) generates the biological energy equivalent ATP. The necessary protons for this process are provided by reactions which concurrently transfer available electrons from central metabolism to electron acceptors. The ETC reactions are versatile and regulated with respect to changing conditions. A publication by Henkel et al. presents a kincetic model focussing on the ETC of Escherichia coli for varying oxygen availability:
[1] S. G. Henkel, A. Ter Beek, S. Steinsiek, S. Stagge, K. Bettenbrock, M. J. Teixeira de Mattos, T. Sauter, O. Sawodny, M. Ederer: "Basic regulatory principles of Escherichia coli's electron transport chain for varying oxygen conditions." In: PLoS ONE, 9(9):e107640, 2014. doi: 10.1371/journal.pone.0107640.
This investigation considers steady states in the chemostat (continuous cultivation), see [2, 3], in response to different oxygen input levels. For the major foundation of the biological and experimental setup, please also see [4–6]. The available data are the starting point for modelling and show a characteristic behaviour for certain biochemical components (metabolite concentrations, transcription factor activities and others). In the following the submodel of the regulated ETC for varying oxygen availability is derived (JavaScript must be activated for displaying formulas). It will be based on artificial yet realistic data, while a larger model, real data as well as a thorough background and discussion is provided in the publication mentioned above. Here, it will be shown, which regulatory mechanisms can explain phenomena in the data best and whether ubiquinone alone can be the major inhibiting factor for ArcA.
Modelling
The starting point of modelling is the following structure containing the most reliable components (including the transcription factors FNR and ArcA) and interactions (enzymatic reactions). This structure must be extended by regulatory interactions (some less reliable information existing) allowing for an adaptation to different oxygen input and for reproduction of data.
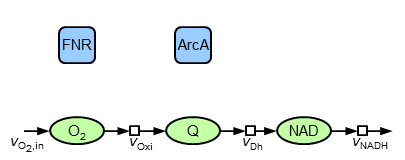
The major (without indication of references and all assumptions) components and interactions are: oxygen is taken up and reacts in reactions of the oxidase type. Also, ubiquinol (QH$_2$) is oxidised to ubiquinone (Q) by the oxidases. This redox pair as well as NADH|NAD is also taking part in reactions of the dehydrogenase type. NADH contains the electrons which are available by central metabolism and transferred to electron acceptors. Since the present model is build up of oxidised species, the interface to other parts of metabolism is represented by a sink flow of NAD. The mathematical equivalent of this structure is described by the following ordinary differential equations:
\begin{align} {\dot c}_\mathrm{O_2} &= v_\mathrm{O_{2},in}-v_\mathrm{Oxi} \\ {\dot c}_\mathrm{Q} &= v_\mathrm{Oxi}-v_\mathrm{Dh} \\ {\dot c}_\mathrm{NAD} &= v_\mathrm{Dh}-v_\mathrm{NADH} \end{align}It is assumed that firstly the reactions are irreversible, that secondly reactions of isoenzymes can be pooled (therefore the model contains only ONE oxidase and ONE dehydrogenase) and that thirdly the total amount of the reduced and oxidised species are constant, i.e. Q+QH$_2$=const. und NAD+NADH=const. For the rate equations common (and plausible) kinetics are applied:
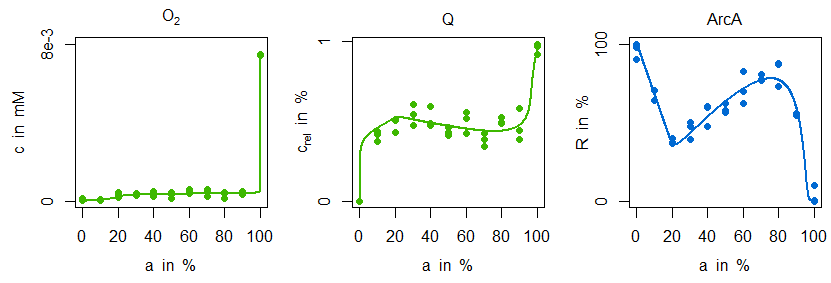
\begin{align} v_\mathrm{O_{2},in} &= \frac{v_\mathrm{O_{2},in,100\%}\times t}{t_\mathrm{end}}\\ v_\mathrm{Oxi} &= a_\mathrm{Oxi}\frac{c_\mathrm{O_{2}}}{(K_\mathrm{m,Oxi,O_{2}}+c_\mathrm{O_{2}})}\frac{c_\mathrm{QH_{2}}}{(K_\mathrm{m,Oxi,O_{2}}+c_\mathrm{QH_{2}})}\\ v_\mathrm{Dh} &= a_\mathrm{Dh}\frac{c_\mathrm{Q}}{(K_\mathrm{m,Dh,Q}+c_\mathrm{Q})}\frac{c_\mathrm{NADH}}{(K_\mathrm{m,Dh,NADH}+c_\mathrm{NADH})}\\ v_\mathrm{NADH} &= v_\mathrm{max,NADH}\frac{c_\mathrm{NAD}/c_\mathrm{NADH}}{K_\mathrm{m,NAD}+c_\mathrm{NAD}/c_\mathrm{NADH}} \end{align}The enzyme activities of oxidase and dehydrogenase represent maximal velocities of the reactions. During simulation the oxygen input flow $v_\mathrm{O_{2},in}$ is changed slowly thus allowing for a comparison between simulated courses and measured steady states. The investigation comprises the question, whether and how different steady states (anaerobic...microaerobic...aerobic, constituted by percentage levels of "aerobiosis" $a$, see definition of [4–6]) of oxygen, ubiquinone and ArcA can be explained:
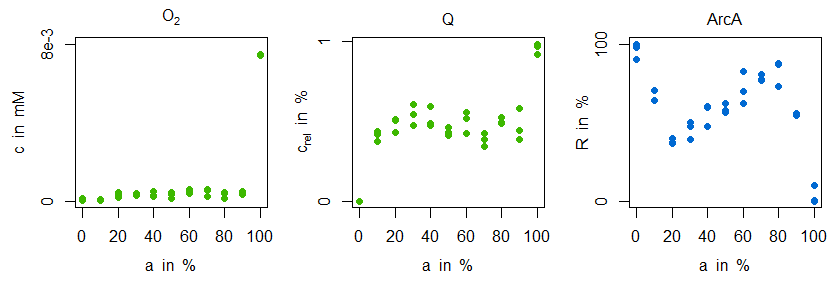
Mainly, it can be observed, that both oxygen and ubiquinone concentrations have a nearly constant level in the microaerobic range (plus strong increases around 100% aerobiosis), while ArcA shows a characteristic course with strong local optima ("zigzag course"). For the sensitive regulation (also: "stabilisation" or "homeostasis") of oxygen concentration for different inflow values the following substructure is introduced (due to the two inhibitions the regulation is positive, but because of the outgoing oxidase this structure means a negative feedback for oxygen):
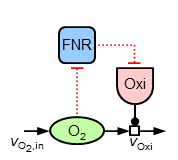
For achieving the observed sensitive regulation the following equations are introduced describing the additional elements of this structure:
\begin{align} R_\mathrm{FNR} &= \frac{c_\mathrm{O_{2}}^{n_\mathrm{FNR}}}{(K_\mathrm{A,FNR,O_{2}}^{n_\mathrm{FNR}}+c_\mathrm{O_{2}}^{n_\mathrm{FNR}})}\\ v_\mathrm{syn,Oxi} &= p_\mathrm{syn,Oxi,min} + p_\mathrm{syn,Oxi,FNR} \times (1-R_\mathrm{FNR})\\ {\dot a}_\mathrm{Oxi} &= v_\mathrm{syn,Oxi}-D \times a_\mathrm{Oxi} \end{align}
Instead of a former constant maximal velocity the last equation introduces a variable oxidase activity. This activity depends on both the synthesis and dilution rate (representing chemostat growth). The synthesis rate $v_\mathrm{syn,Oxi}$ is an algebraic equation in which the first term describes a basal expression and the second term a synthesis depending on transcrition factor activity (negatively). The most important for the sensitive regulation is the first equation of the transcription factor, because it is a Hill-type algebraic equation. A negativ exponent with a large absolute value is leading to an oxygen-dependent almost switching behaviour (similar to cooperativity such a functionality can be argued for by sequential binding, multiple binding sites or other effects). In the next figure (left) the course of sensitive regulation is displayed:
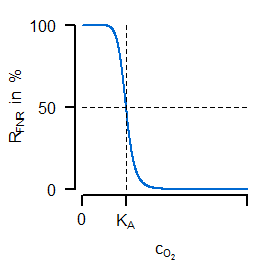
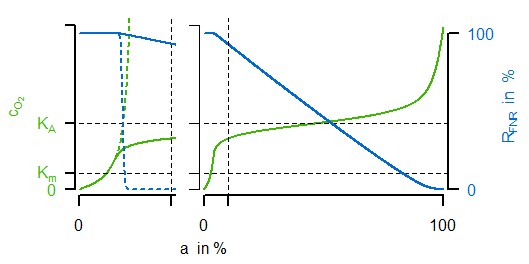
FNR is showing a decreasing activity for increased oxygen concentration with a large drop around $K_A$. The right subfigure compares simulated courses for the unregulated (dashed) and regulated (solid) case. For the latter one, the oxygen concentration (green) is indeed showing the desired characteristic course for varying oxygen availability in the reactor (not shown: the resulting progressive course of oxidase flux).
Now, it can be asked, whether in a similar way (local sensitive regulation) the nearly constant ubiquinone concentration can be achieved. To test different hypothesis, in the following the two model variants "M1" and "M2" of regulatory strucures are investigated:
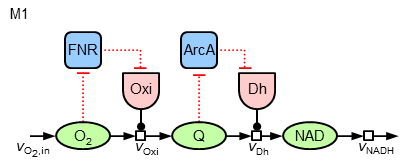
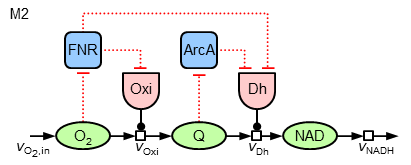
The mathematics behind the additional regulatory interactions are identical to the ones for the regulation of the oxidase. While M1 introduces only a local regulation of the dehydrogenase by ArcA, M2 also contains a further regulatory influence on the expression of this enzyme by FNR (leading to three terms in the synthesis equation).
Since the determination of unknown parameter values depicts an essential step in modelling metabolism it will now be explained for the parametrisation of the two model variants.
Parameter Estimation (Identification)
Parameter estimation (also: identification) is a common step to find unknown values of parameters $\underline{\theta}$, i.e. adjusting them automatically to find the best match between simulated and measured data, $\hat{y}_i(\underline{\theta})$ and $y_i$, respectively. During this process, models must be simulated multiple times, which in case of ordinary differential equations means solving initial value problems. Methods for that are available in respective software environments or languages. The difference between simulation and measurement as a measure of model adjustment is determined by an objective funtion (goal function, error function,etc.). Under the assumption of normal-distributed measurement uncertainties (variance $\sigma_{i}^2$) the following objective function is set up and the parameter identified by minimising the sum of the squared errors:
\begin{align} \chi^2(\underline{\theta}) &= \sum_{i=1}^{N}\frac{\left(y_{i}-\hat{y}_{i}(\underline{\theta})\right)^2}{\sigma_{i}^2} \end{align}
The minimisation is carried out iteratively and automatically by software implementations of respective (non-linear) optimisation algorithms. The identified parameter values of the two model variants are given in the next table:
| $K_\mathrm{m,Oxi,O_2}$ | $K_\mathrm{m,Oxi,QH_2}$ | $K_\mathrm{m,Dh,Q}$ | $K_\mathrm{m,Dh,NAD}$ | $v_\mathrm{max,NADH}$ | $K_\mathrm{m,NADH}$ | $K_\mathrm{A,FNR,O_2}$ | $n_\mathrm{FNR}$ | $K_\mathrm{A,ArcA,Q}$ | $n_\mathrm{ArcA}$ | $p_\mathrm{syn,Oxi,min}$ | $p_\mathrm{syn,Oxi,FNR}$ | $p_\mathrm{syn,Dh,min}$ | $p_\mathrm{syn,Dh,ArcA}$ | $p_\mathrm{syn,Dh,FNR}$ | |
| $\mathrm{M1}$ | $4.51\mathrm{e}{-5}$ | $1\mathrm{e}{-5}$ | $4.06\mathrm{e}{-3}$ | $1.56\mathrm{e}{-3}$ | $11.91$ | $6.12$ | $3.63\mathrm{e}{-4}$ | $-10$ | $0.52$ | $-10$ | $0.68$ | $1.68$ | $7.97\mathrm{e}{-3}$ | $4.32$ | $\mathrm{---}$ |
| $\mathrm{M2}$ | $9.42\mathrm{e}{-5}$ | $0.05$ | $0.01$ | $0.01$ | $12.00$ | $2.5$ | $4.02\mathrm{e}{-4}$ | $-10$ | $0.50$ | $-9.98$ | $0.74$ | $4.50$ | $0.01$ | $0.75$ | $4.8$ |
It should be noted, that major differences occur in the parameters of regulation. In particular, for the parameter values concerning the epxression of dehydrogenase it can be observed that firstly the ArcA-dependent regulation is stronger in M1 (missing FNR-dependency) and secondly in M2 the regulation of the dehydrogenase by FNR has the strongest impact.
Simulation and Interpretation
In the next figure simulations of the parametrised model variant M1 is compared with the measurement data:
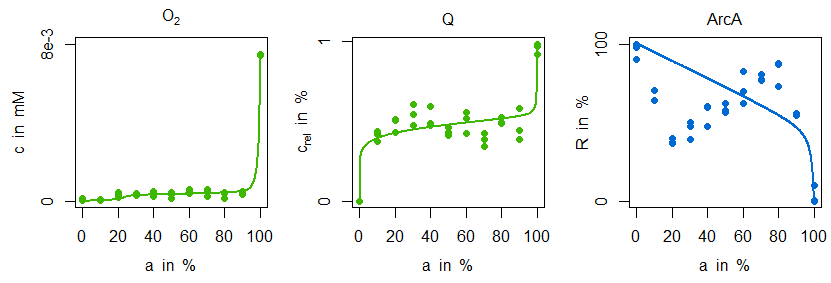
Indeed, the sensitive regulation via ArcA is leading to a good reproduction of ubiquinone concentration measurements. However, the characteristic zigzag course of ArcA cannot be mirrored by simulation data. The situation is improved by model variant M2. Not only is there a good agreement in the ArcA data, but also the minimal decrease of ubiquinone in the microaerobic range is reproduced:
This behaviour can be explained by the additional and stronger regulatory influence of FNR on dehydrogenase expression: the information about an increased oxygen availability is forwarded to the dehydrogenase reaction and due to its strength leading to the minimal ubiquinone decline and the characteristic ArcA course. From a biological point of view this regulatory motive is not only quite common, [7], but has also some advantages. Firstly, FNR and especially ArcA can have a distinguished impact on global regulation, in particular on different isoenzymes. Secondly, this regulatory motive has better dynamical properties for cases in which there are fast and almost noisy changes of oxygen availability as they can occur in natural environments.
In a broader and more realistic context of the above mentioned publication these principles of regulated ETC are embedded in a larger model (e.g. coupled to a phenomenological growth model) and discussed more thoroughly.
References
- [1] S. G. Henkel, A. Ter Beek, S. Steinsiek, S. Stagge, K. Bettenbrock, M. J. Teixeira de Mattos, T. Sauter, O. Sawodny, M. Ederer: Basic regulatory principles of Escherichia coli's electron transport chain for varying oxygen conditions. In: PLoS ONE, 9(9):e107640, 2014. doi: 10.1371/journal.pone.0107640
- [2] A. Novick, L. Szilard: Experiments with the Chemostat on spontaneous mutations of bacteria. In: Proc. Natl. Acad. Sci. USA, 36(12):708–719, 1950. doi: 10.1073/pnas.36.12.708
- [3] A. Novick, L. Szilard: Description of the Chemostat. In: Science, 112:715–716, 1950. doi: 10.1126/science.112.2920.715
- [4] S. Alexeeva, B. de Kort, G. Sawers, K. J. Hellingwerf, M. J. Teixeira de Mattos: Effects of limited aeration and of the ArcAB system on intermediary pyruvate catabolism in Escherichia coli. In: J. Bacteriol., 182(17):4934–4940, 2000. doi: 10.1128/JB.182.17.4934-4940.2000
- [5] S. Alexeeva, K. J. Hellingwerf, M. J. Teixeira de Mattos: Quantitative assessment of oxygen availability: perceived aerobiosis and its effect on flux distribution in the respiratory chain of Escherichia coli. In: J. Bacteriol., 184(5):1402–1406, 2002. doi: 10.1128/JB.184.5.1402-1406.2002
- [6] S. Alexeeva, K. J. Hellingwerf, M. J. Teixeira de Mattos: Requirement of ArcA for redox regulation in Escherichia coli under microaerobic but not anaerobic or aerobic conditions. In: J. Bacteriol., 185(1):204–209, 2003. doi: 10.1128/JB.185.1.204-209.2003
- [7] S. Mangan, U. Alon: Structure and function of the feed-forward loop network motif. In: Proc. Natl. Acad. Sci. USA, 100(21):11980–11985, 2003. doi: 10.1073/pnas.2133841100