
Omics Analysis
(Immune Respone to Infections)
(Version: January 2016)
The variation of different conditions and the measurement of many different data (types) is one of the main ways for tackling open biological questions. If the measurement concerns high-throughput of a special type of data regarding their biological function this data is denoted by the term "omics", e.g. transcriptomics or secretomics. After measurement the data must be analysed. BioControl posesses the biological-technical background, specialised algorithms and appropriate ways of visualization for this analysis. In the following, an example workflow is presented regarding the omics analysis of the immune response to infections.
Please note: BioControl adapts and re-combines different methods for matching the needs of the experimental partner's respective problem.
Background
Biological questions behind omics analyses mainly concern specific processes and their mechanisms. Quite often the response of biochemical components with respect to different conditions is investigated, e.g. mutations, environmental conditions or pathogens.
In the present example, third-party yet publically available transcriptome data, measured by Illumina Microarrays ("Illumina HumanHT-12 V4.0 expression beadchip") are re-analysed:
[1] Sanne P. Smeekens et al.: "Functional genomics identifies type I interferon pathway as central for host defense against Candida albicans." In: Nat Commun, 4:1342, 2013. doi: 10.1038/ncomms2343, GEO: GSE42606.
The data are part of an investigation concerning the response of the immune system (represented by mononuclear cells of peripheral blood, PBMC) with respect to different conditions, in particular the infection by Candida albicans and the focus on the "type I interferon" pathway. The study contains replicates of non-infected blood (30+35) as well as infection (stimulation) by Borrelia (31+36), Candida (24+34), LPS (26+24) and Tuberculosis (23+36) at 4h and 24h. The following results are not a duplicate of the mentioned publication (in particular not the comparison between healthy and compromised donors) but a selection originating from a new separate analysis.
Methods and Results
In the following, single steps of the analysis are described. These comprise measurement-specific pre-processing, statistical tests for determination of differential expression of transcripts and an enrichment analysis (determination of significantly occurring categories or pathways). This overview refrains from showing the optional but quite important step of network inference, see [2, 3], as well as other possible analyses (including the ones presented in the original paper).
Data pre-processing
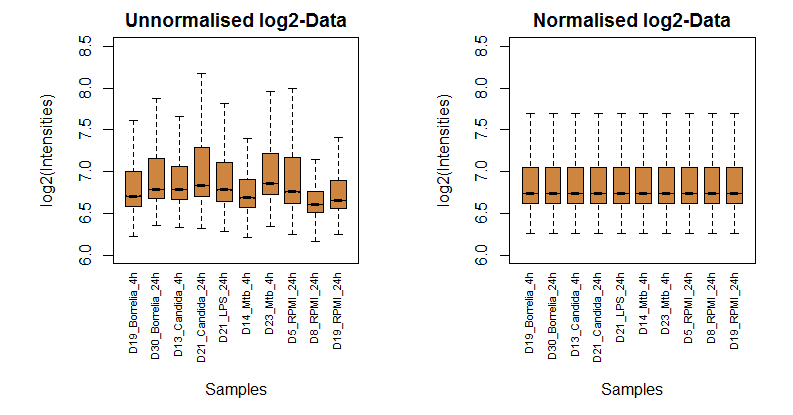
The analysis starts with a measurement-specific pre-processing. It depends on the experimental setup, the measurement platform (e.g. different microarray chips by Affymetrix, Illumina, etc.) and the related distribution of uncertainty. The present example normalises the data under the assumption that different samples (the transcriptome measured by Illumina microarrays) should exhibit similar quantile distributions, see [4]. This normalisation step is a necessary condition of determining significantly changed components.
The following two plots compare the distribution of 10 randomly chosen samples before and after normalisation:
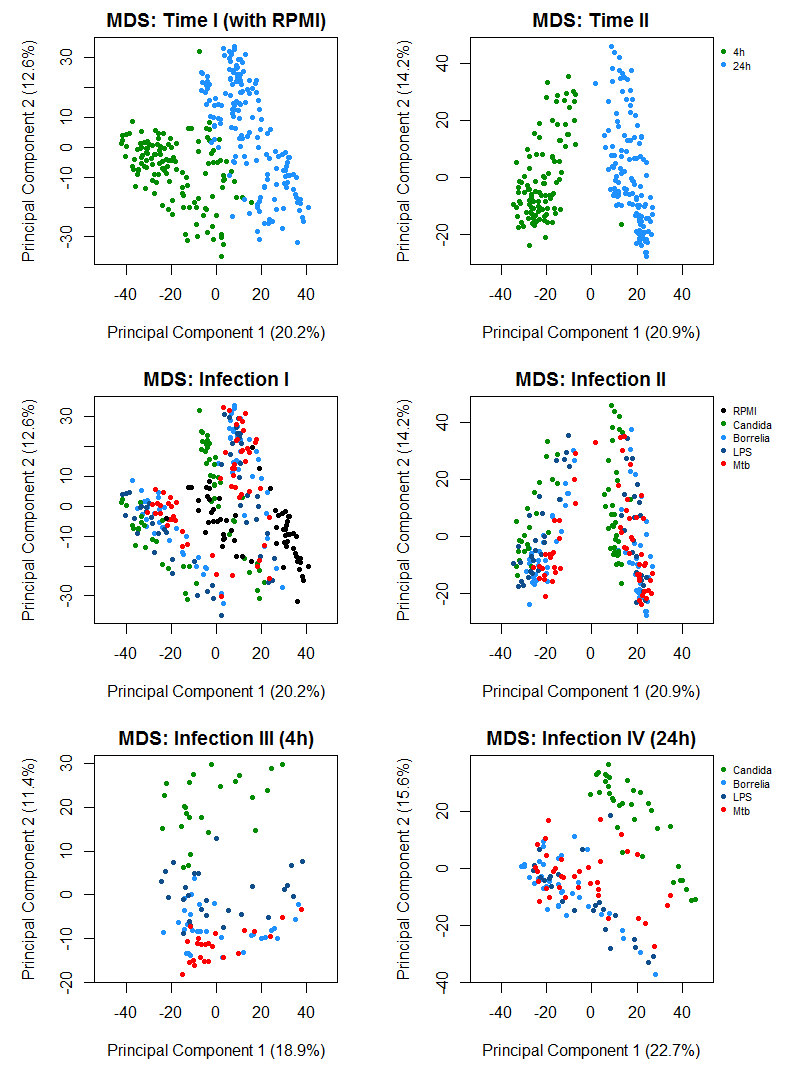
For a preliminary analysis of similarity between samples or pre-defined groups the major two principal components can be evaluated. For this purpose, here the method "multi-dimensional scaling" is applied, see [5], and the results visualized. The plots (colouring time point, infection, control) show, how the data can be separated by time point and infection. In particular, it can be observed that (1) the separation with respect to time is strongest, (2) the donors have quite an effect and (3) there is a noticeable separation between Candida and the other three conditions:
Statistical tests
(differential expression and specific responses)
Significantly changed components (with respect to their control values) can be determined by means of statistical testing. Those results form the basis for an analysis of the components (names, number, intensity) and subsequent investigations like the enrichment analysis (functional annotation).
Here, the starting point for the statistical tests are the normalised logarithmic data. Roughly speaking, the testing corresponds to a specific comparison of groups formed by replicates and under certain assumptions (here: linear model, normally-ditributed error). In the present case the different conditions are compared to their respective controls at each of the time points (4h and 24h), because as shown above the control itself is changing through time.
The applied test uses the specific method "TREAT", see [6]. The significance is determined with respect to thresholds of fold-change (here: 1.1) and adjusted p-value (here: 0.05, see [7]). This method is one of the variants for testing linear models contained in the R-package "limma", see [8]. For investigating the results in the following, heatmaps, (Venn) diagrams and result tables are shown.
The first table shows the numbers for top genes, which are differentially expressed after infection by Candida:
| ProbeID | EntrezID | SymbolID | fc | padj |
|---|---|---|---|---|
| ILMN_2218856 | 414062 | CCL3L3 | 48.79 | 1.51E-55 |
| ILMN_2207291 | 3458 | IFNG | 44.71 | 1.27E-64 |
| ILMN_1728106 | 7124 | TNF | 44.45 | 1.16E-66 |
| ILMN_1747355 | 414062 | CCL3L3 | 42.47 | 1.41E-50 |
| ILMN_1671509 | 6348 | CCL3 | 41.25 | 1.52E-48 |
| ... | ... | ... | ... | ... |
| ILMN_2197365 | 5997 | RGS2 | -3.25 | 5.80E-25 |
| ILMN_1774761 | 729230 | CCR2 | -3.60 | 1.01E-14 |
| ILMN_1663866 | 7045 | TGFBI | -3.75 | 1.41E-07 |
| ILMN_1686623 | 1436 | CSF1R | -3.94 | 6.55E-12 |
| ILMN_1687301 | 1462 | VCAN | -4.57 | 6.01E-11 |
Now, the number of genes in SPECIFIC sub-sets of the conditions shall be determined. For this purpose in the following, two different ways of visualization are presented. The first one is a typical Venn-diagram, in this case based on the usual approach of testing conditions against the control (and subsequent set operations). The second one has the form of a matrix or table, is suitable for a large number of conditions, and in this case displays the number of genes which are additionally differentially changed BETWEEN the conditions (i.e. using additional tests).
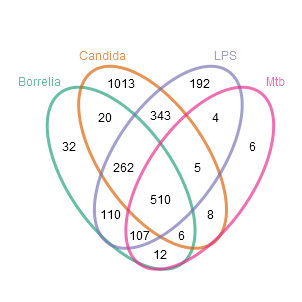
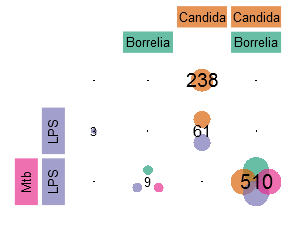
Here, it is shown that on the one hand there are many Candida-specific genes and on the other hand there are even more genes differentially expressed in all conditions (510). From the genes selected from the second test/visualization also a heatmap (download here) was generated mainly showing the expression levels of each gene (as well as dendrograms grouping genes with respect to their similarity in expression). Again, this figure shows that there are many genes exclusively up-regulated by Candida (e.g. CCL8, CXCL10 und TNFSF13B) and some other genes, for example CCL3L3, TNF, CCL3 oder CCL3L1, form a common core response after infection.
Apart from the displayed levels, the plain numbers of expression and significance are of interest. Therefore in the following, the top-10 genes of the core response and the Candida-specific response are displayed (sorted with respect to fold change after Candida infection, up and down regulation):
| ProbeID | EntrezID | SymbolID | fc_Borrelia_4h | fc_Candida_4h | fc_LPS_4h | fc_Mtb_4h | padj_Borrelia_4h | padj_Candida_4h | padj_LPS_4h | padj_Mtb_4h |
|---|---|---|---|---|---|---|---|---|---|---|
| ILMN_2218856 | 414062 | CCL3L3 | 18.91 | 48.79 | 36.07 | 15.65 | 1.57E-40 | 1.51E-55 | 5.80E-51 | 4.28E-32 |
| ILMN_1728106 | 7124 | TNF | 6.15 | 44.45 | 6.51 | 4.26 | 2.87E-24 | 1.16E-66 | 5.38E-24 | 9.02E-14 |
| ILMN_1747355 | 414062 | CCL3L3 | 20.75 | 42.47 | 35.94 | 18.07 | 2.30E-40 | 1.41E-50 | 1.86E-48 | 6.09E-33 |
| ILMN_1671509 | 6348 | CCL3 | 23.14 | 41.25 | 37.34 | 20.40 | 4.71E-41 | 1.52E-48 | 1.01E-47 | 5.97E-34 |
| ILMN_1773245 | 6349 | CCL3L1 | 12.05 | 40.45 | 28.13 | 10.95 | 7.12E-24 | 2.57E-41 | 3.59E-36 | 3.09E-19 |
| ... | ... | ... | ... | ... | ... | ... | ... | ... | ... | ... |
| ILMN_1769895 | 729230 | CCR2 | -2.90 | -3.25 | -3.05 | -2.48 | 1.85E-12 | 5.11E-14 | 7.84E-13 | 1.33E-07 |
| ILMN_2197365 | 5997 | RGS2 | -2.32 | -3.25 | -2.77 | -2.36 | 2.10E-14 | 5.80E-25 | 1.29E-19 | 9.48E-13 |
| ILMN_1774761 | 729230 | CCR2 | -3.06 | -3.60 | -3.27 | -2.55 | 2.67E-12 | 1.01E-14 | 6.68E-13 | 3.20E-07 |
| ILMN_1663866 | 7045 | TGFBI | -4.77 | -3.75 | -7.67 | -3.13 | 2.34E-11 | 1.41E-07 | 1.57E-17 | 5.14E-05 |
| ILMN_1686623 | 1436 | CSF1R | -4.67 | -3.94 | -7.38 | -3.13 | 3.12E-16 | 6.55E-12 | 3.65E-24 | 1.54E-07 |
| ProbeID | EntrezID | SymbolID | fc_Borrelia_4h | fc_Candida_4h | fc_LPS_4h | fc_Mtb_4h | padj_Borrelia_4h | padj_Candida_4h | padj_LPS_4h | padj_Mtb_4h |
|---|---|---|---|---|---|---|---|---|---|---|
| ILMN_1772964 | 6355 | CCL8 | 1.98 | 27.48 | 1.62 | 1.76 | 4.52E-01 | 3.85E-23 | 1.00E+00 | 1.00E+00 |
| ILMN_1791759 | 3627 | CXCL10 | -1.11 | 14.24 | -1.25 | -1.18 | 1.00E+00 | 2.31E-19 | 1.00E+00 | 1.00E+00 |
| ILMN_1801307 | 8743 | TNFSF10 | 1.01 | 5.64 | 1.33 | -1.40 | 1.00E+00 | 1.01E-33 | 7.92E-01 | 7.82E-01 |
| ILMN_2148785 | 2633 | GBP1 | 1.36 | 5.06 | 1.72 | 1.20 | 1.00E+00 | 1.56E-13 | 1.76E-01 | 1.00E+00 |
| ILMN_1701114 | 2633 | GBP1 | 1.31 | 4.28 | 1.53 | 1.01 | 1.00E+00 | 6.70E-12 | 5.94E-01 | 1.00E+00 |
| ... | ... | ... | ... | ... | ... | ... | ... | ... | ... | ... |
| ILMN_1728236 | 55106 | SLFN12 | -1.06 | 1.20 | -1.04 | -1.05 | 1.00E+00 | 4.92E-02 | 1.00E+00 | 1.00E+00 |
| ILMN_1684634 | NA | RP3-365I19.1-001 | -1.06 | 1.20 | -1.02 | -1.02 | 1.00E+00 | 9.40E-03 | 1.00E+00 | 1.00E+00 |
| ILMN_2088990 | 80231 | CXorf21 | -1.02 | 1.19 | -1.00 | -1.03 | 1.00E+00 | 8.59E-03 | 1.00E+00 | 1.00E+00 |
| ILMN_1712035 | 11070 | TMEM115 | 1.01 | -1.26 | 1.01 | 1.05 | 1.00E+00 | 4.91E-03 | 1.00E+00 | 1.00E+00 |
| ILMN_1699253 | 7417 | VDAC2 | 1.01 | -1.27 | -1.02 | 1.01 | 1.00E+00 | 6.10E-04 | 1.00E+00 | 1.00E+00 |
Enrichment Analysis
(functional annotation)
Finally, gene groups shall be analysed with respect to the occurrence of overrepresented functionalities. Thereby, the present yet complex knowledge can be searched and sorted on a statistical foundation. In particular, the response of investigated conditions can be analysed on a functional level. The class of methods for this purpose is called enrichment analysis, see [9], which can be further subdivided with respect to the test objectives: (1) distributions and (2) frequencies of occurrence. The latter is carried out in the following and basically applies a test (χ²-test, hypergeometric test, exact Fisher-test or similar) on contingency tables (confusion matrices).
The prerequisite for enrichment are known categories (i.e. groups), in particular ones of biological functionality stored in respective databases or ontologies. The most frequently used categories are from "Gene Ontology" and "KEGG Pathways". It should be noted, that the first exhibits the structure of a directed acyclic graph (i.e. a hierarchy), in which "child" terms and their members also belong to "parent" terms but not vice versa. Therefore, this dependency should be considered for enrichment as it was described in [10].
The following plots show the respective top-10 enriched categories (from GO and KEGG) for genes of the core response and genes differentially expressed after Candida infection (for enrichment of KEGG pathways the platform FungiFun2 was used, see [11]):
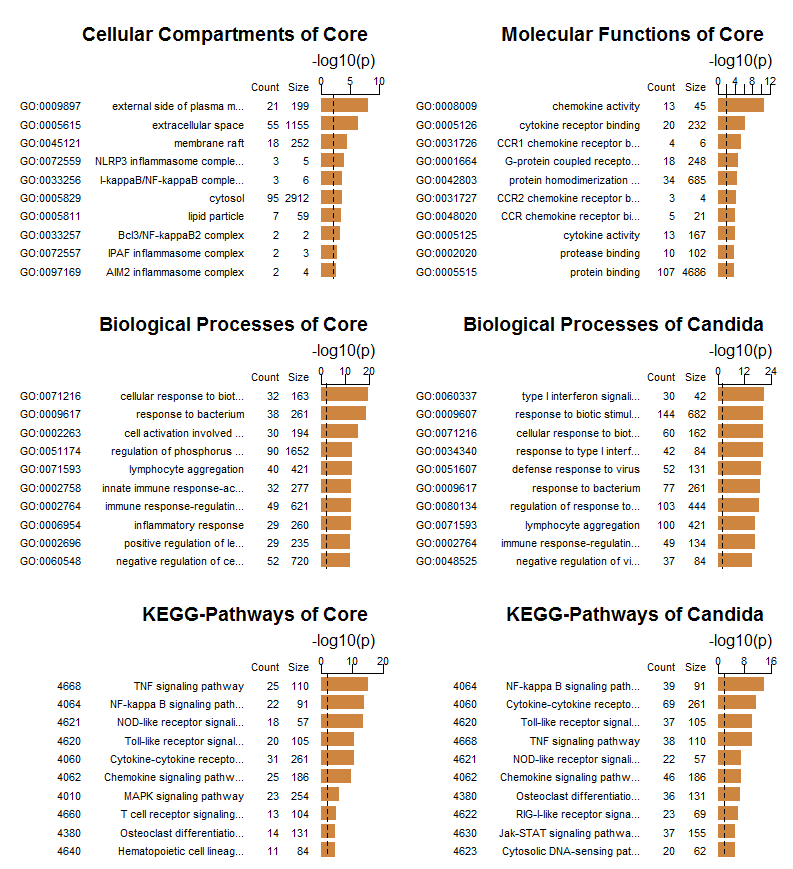
The GO-enrichment regarding cellular components and molecular functions is mainly according to expectations. The main result of the biological processes enriched after Candida infection is the significant occurrence of type I interferon signalling (as also emphasised in the original publication). The comparison of KEGG pathways nicely shows the different signalling between the core response and after Candida infection. Further interpretation of these results should be carried out together with experts from biology and medicine.
(The full results are available at BioControl)
References
- [1] S. P. Smeekens, A. Ng, V. Kumar, M. D. Johnson, T. S. Plantinga, C. van Diemen, P. Arts, E. T. P. Verwiel, M. S. Gresnigt, K. Fransen, S. van Sommeren, M. Oosting, S.-C. Cheng, L. A. B. Joosten, A. Hoischen, B.-J. Kullberg, W. K. Scott, J. R. Perfect, J. W. M. van der Meer, C. Wijmenga, M. G. Netea and R. J. Xavier: Functional genomics identifies type I interferon pathway as central for host defense against Candida albicans. In: Nat Commun, 4:1342, 2013. doi: 10.1038/ncomms2343
- [2] J. Linde, S. Schulze, S. G. Henkel and R. Guthke: Data- and knowledge-based modeling of gene regulatory networks: an update. In: EXCLI Journal, 14:346–378, 2015.
doi: 10.17179/excli2015-168 - [3] M. Weber, S. G. Henkel, S. Vlaic, R. Guthke, E. J. van Zoelen and D. Driesch, Inference of dynamical gene-regulatory networks based on time-resolved multi-stimuli multi-experiment data applying NetGenerator V2.0. In: BMC Syst Biol, 7:1, 2013.
doi: 10.1186/1752-0509-7-1 - [4] B. M. Bolstad, R. A. Irizarry, M. Astrand and T. P. Speed: A comparison of normalization methods for high density oligonucleotide array data based on variance and bias. In: Bioinformatics, 19(2):185–193, 2003. doi: 10.1093/bioinformatics/19.2.185
- [5] W. S. Togerson: Theory and methods of scaling. New York: J. Wiley, 1958. ISBN: 978-0471879459
- [6] D. J. McCarthy and G. K. Smyth: Testing significance relative to a fold-change threshold is a TREAT. In: Bioinformatics, 25(6):765–771, 2009. doi: 10.1093/bioinformatics/btp053
- [7] Y. Benjamini and Y. Hochberg: Controlling the False Discovery Rate: a practical and powerful approach to multiple testing. In: Journal of the Royal Statistical Society, Series B, 57(1):289–300, 1995.
- [8] M. E. Ritchie, B. Phipson, D. Wu, Y. Hu, C. W. Law, W. Shi and G. K. Smyth: limma powers differential expression analyses for RNA-sequencing and microarray studies. In: Nucleic Acids Research, 43(7):e47, 2015. doi: 10.1093/nar/gkv007
- [9] D. W. Huang, B. T. Sherman and R. A. Lempicki: Bioinformatics enrichment tools: paths toward the comprehensive functional analysis of large gene lists. In: Nucleic Acids Research, 37(1):1–13, 2009. doi: 10.1093/nar/gkn923
- [10] S. Falcon and R. Gentleman: Using GOstats to test gene lists for GO term association. In: Bioinformatics, 23(2):257–258, 2007. doi: 10.1093/bioinformatics/btl567
- [11] S. Priebe, C. Kreisel, F. Horn, R. Guthke and J. Linde: FungiFun2: a comprehensive online resource for systematic analysis of gene lists from fungal species. In: Bioinformatics, 31(3):445–446, 2015. doi: 10.1093/bioinformatics/btu627